Logging in applications
Logging is a mechanism that developers use to record important events, errors, important and helpful information in a physical file. This is a good development practice that is followed by professional developers when writing complex applications. There are so many benefits if a good logging system is integrated into a software system.
- Developers find it easy to find important events logged in when debugging.
- Users can find out what are the carried out events in the software system.
- Errors can be observed.
- Warnings can be observed.
- Logs can be later used to analyse the user behaviours and system behaviours.
- Errors and warnings can be used for debugging purposes.
Typically, developers may include whatever the information that is needed for the above purposes. But there are some considerations.
- Log files may consume the server space.
- Logging unwanted information can be less useful.
- Logging should not affect the system performance.
ELK Stack
There are so many tools available for log implementations just one google search away. ELK is one technology stack which helps you to pipe, store, and analyze data. ELK stands for three tools: Elasticsearch, Logstash and Kibana.
- Logstash - Reads your log files for updates and pipe them for the Elasticsearch storage.
- Elasticsearch - Stores the log files for better indexing.
- Kibana - Visualizes data stored in the Elasticsearch storage.
Usage if the ELK stack gives the following benefits.
- Store, search, Index and visualize the logs.
- Define formats for logs and notify if the logs are not according to the format.
- Analyze for user patterns, behaviour patterns, etc.
- Create useful visualizations, graphs, etc.
- Integrate your data stored in the Elasticsearch storage with many additional tools.

Logstash
Logstash is a service deployed in the same server as the Telzee application runs. The logs created from the Telzee application are monitored and the changes are pushed to the Elasticsearch server.
Logstash can filter data and pinpoint which logs can not match the given filter type. Grok is a helpful Logstash plugin which helps keep the log formatting.
grok {
	patterns_dir => ["/home/ubuntu"]
	match => { "message" => '\[%{DATA:timestamp}\]  \[%{WORD:logLevel}\] - \[%{WORD:room}\]  \[%{IP:ipaddress}\] %{GREEDYDATA:content}'}
	break_on_match => false
}
Logstash can read logs in a defined path and push them to a number of services and Elasticsearch is one of them. To read an input log file we can define where it is located along with some other parameters.
file {
	type => "errors"
	path => "/logpath/errors.log"
	start_position => "beginning"
	codec => multiline {
		pattern => "^\[%{DATA:timestamp}\]"
		negate => true
		what => "previous"
    }
}
The content of the file will go through the Grok filter and is pushed in to the output destination.
output{
	elasticsearch {
		hosts => ["ip:port"]
	}
	stdout {}
}
Elasticsearch
Elasticsearch is the storage for the log files which can handle huge data chunks. Elasticsearch will also index the data if they are properly formatted so the searching process is made easy. Elasticsearch can also accept data input from other services apart from Logstash.
Kibana
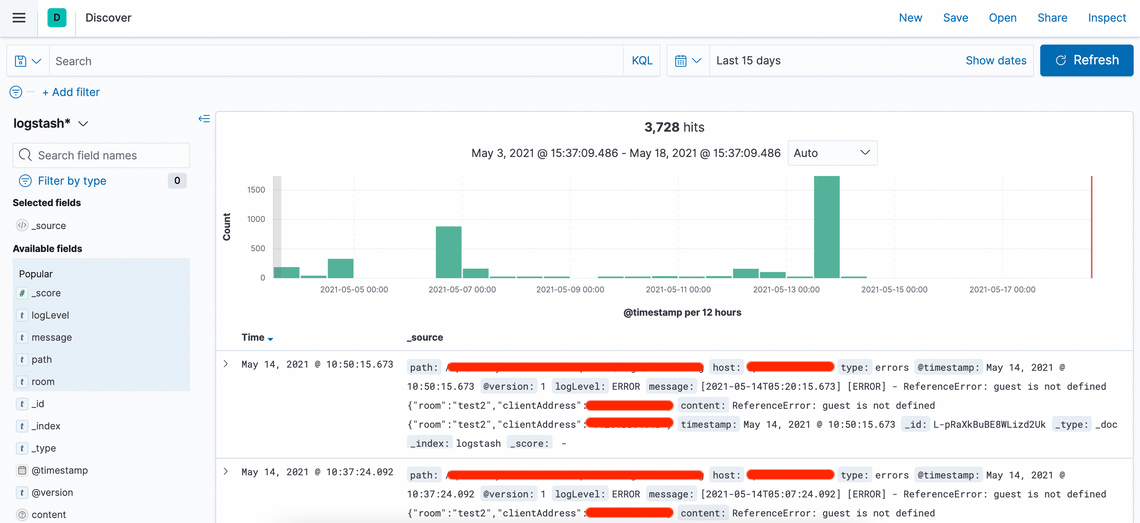
Kibana is a tool that offers visualization features for data stored in Elasticsearch. Users have the following benefits from the Kibana tool.
- Visualization for Elasticsearch data.
- Filtering.
- Users can create and save dashboards and graphs.
- Can see Elasticsearch datastore information.


