
Introduction:
To build an effective monitoring system, it should have the ability to handle complex microservices. This includes the capability to trace transactions across services, simplifying debugging and optimizing performance. Additionally, it should provide insights into request-response times to enhance the user experience. Prioritizing root cause analysis and identifying trends in system logs and metrics is crucial for proactive issue mitigation and ensuring system stability. Real-time alerts via email or Slack, coupled with anomaly detection, are essential components to promptly address and notify of any irregularities or errors in the system.
Architecture Overview:
We use ELK, APM, Filebeat, Metricbeat, and CloudWatch for our monitoring system. Deploying ELK on the cloud is convenient, as we can easily sign up and deploy the service. Our Node.js application is deployed on Elastic Beanstalk, and we use Filebeat to ship log files to ELK. APM allows us to track transactions and monitor API performance, automatically capturing errors. Kibana enables us to view logs, request-response times, and transactions. We have also set up alerts through Kibana. Our event microservice is built on top of the serverless stack, and we use Filebeat to pull logs from CloudWatch.
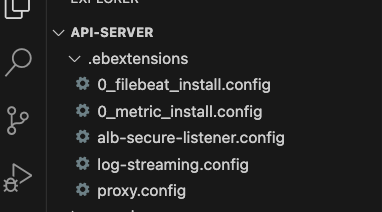
Beanstalk Node.js Application Integration:
files:
  "/etc/filebeat/filebeat.yml":
    mode: "000755"
    owner: root
    group: root
    content: |
      filebeat.inputs:
      - type: aws-cloudwatch
        log_group_arn: arn:aws:logs:AWS_REGION:ACCOUNT_ID:log-group:/aws/lambda/event-service-ELASTIC_APM_ENV-basicEventHandler:*
        scan_frequency: 5m
        enabled: true
        access_key_id: ELK_AWS_ACCESS_KEY_ID
        secret_access_key: ELK_AWS_SECRET_ACCESS_KEY
        start_position: beginning
      - type: aws-cloudwatch
        log_group_arn: arn:aws:logs:AWS_REGION:ACCOUNT_ID:log-group:/aws/lambda/event-service-ELASTIC_APM_ENV-connectionHandler:*
        scan_frequency: 5m
        enabled: true
        access_key_id: ELK_AWS_ACCESS_KEY_ID
        secret_access_key: ELK_AWS_SECRET_ACCESS_KEY
        start_position: beginning
      - type: aws-cloudwatch
        log_group_arn: arn:aws:logs:AWS_REGION:ACCOUNT_ID:log-group:/aws/lambda/event-service-ELASTIC_APM_ENV-disconnectionHandler:*
        scan_frequency: 5m
        enabled: true
        access_key_id: ELK_AWS_ACCESS_KEY_ID
        secret_access_key: ELK_AWS_SECRET_ACCESS_KEY
        start_position: beginning
      - type: aws-cloudwatch
        log_group_arn: arn:aws:logs:AWS_REGION:ACCOUNT_ID:log-group:/aws/lambda/event-service-ELASTIC_APM_ENV-enhancedEventHandler:*
        scan_frequency: 5m
        enabled: true
        access_key_id: ELK_AWS_ACCESS_KEY_ID
        secret_access_key: ELK_AWS_SECRET_ACCESS_KEY
        start_position: beginning
      - type: aws-cloudwatch
        log_group_arn: arn:aws:logs:AWS_REGION:ACCOUNT_ID:log-group:/aws/lambda/event-service-ELASTIC_APM_ENV-fetchEventHandler:*
        scan_frequency: 5m
        enabled: true
        access_key_id: ELK_AWS_ACCESS_KEY_ID
        secret_access_key: ELK_AWS_SECRET_ACCESS_KEY
        start_position: beginning
      - type: aws-cloudwatch
        log_group_arn: arn:aws:logs:AWS_REGION:ACCOUNT_ID:log-group:/aws/lambda/event-service-ELASTIC_APM_ENV-mainScheduler:*
        scan_frequency: 5m
        enabled: true
        access_key_id: ELK_AWS_ACCESS_KEY_ID
        secret_access_key: ELK_AWS_SECRET_ACCESS_KEY
        start_position: beginning
      - type: aws-cloudwatch
        log_group_arn: arn:aws:logs:AWS_REGION:ACCOUNT_ID:log-group:/aws/lambda/event-service-ELASTIC_APM_ENV-optionHandler:*
        scan_frequency: 5m
        enabled: true
        access_key_id: ELK_AWS_ACCESS_KEY_ID
        secret_access_key: ELK_AWS_SECRET_ACCESS_KEY
        start_position: beginning
      - type: aws-cloudwatch
        log_group_arn: arn:aws:logs:AWS_REGION:ACCOUNT_ID:log-group:/aws/lambda/event-service-ELASTIC_APM_ENV-presenceHandler:*
        scan_frequency: 5m
        enabled: true
        access_key_id: ELK_AWS_ACCESS_KEY_ID
        secret_access_key: ELK_AWS_SECRET_ACCESS_KEY
        start_position: beginning
      - type: aws-cloudwatch
        log_group_arn: arn:aws:logs:AWS_REGION:ACCOUNT_ID:log-group:/aws/lambda/event-service-ELASTIC_APM_ENV-wssPingHandler:*
        scan_frequency: 5m
        enabled: true
        access_key_id: ELK_AWS_ACCESS_KEY_ID
        secret_access_key: ELK_AWS_SECRET_ACCESS_KEY
        start_position: beginning
      - type: log
        enabled: true
        paths:
          - /var/app/current/logs/errors.log
          - /var/app/current/logs/events.log
          - /var/app/current/logs/messages.log
          - /var/app/current/logs/shell.log
          - /var/app/current/logs/warnings.log
        fields:
          environment: ELASTIC_APM_ENV
      cloud.id: "ELK_CLOUD_ID"
      cloud.auth: "ELK_CLOUD_AUTH"
      filebeat.name: 'api-server-filebeat'
  "/home/ec2-user/beat_env_setup.sh":
    mode: "000755"
    owner: root
    group: root
    content: |
      #!/bin/bash
          sudo yum install jq
          echo "elastic beanstal env print"
          ELK_CLOUD_AUTH=$(/opt/elasticbeanstalk/bin/get-config environment -k ELK_CLOUD_AUTH)
          ELK_CLOUD_ID=$(/opt/elasticbeanstalk/bin/get-config environment -k ELK_CLOUD_ID)
          ELASTIC_APM_ENV=$(/opt/elasticbeanstalk/bin/get-config environment -k ELASTIC_APM_ENV)
          ELK_AWS_ACCESS_KEY_ID=$(/opt/elasticbeanstalk/bin/get-config environment -k ELK_AWS_ACCESS_KEY_ID)
          ELK_AWS_SECRET_ACCESS_KEY=$(/opt/elasticbeanstalk/bin/get-config environment -k ELK_AWS_SECRET_ACCESS_KEY)
          AWS_REGION=$(ec2-metadata --availability-zone | cut -d " " -f 2 | sed 's/.$//')
          ACCOUNT_ID=$(aws sts get-caller-identity --query 'Account' --output text)
          ELASTIC_APM_ENV=$(/opt/elasticbeanstalk/bin/get-config environment -k ELASTIC_APM_ENV)
          sed -i "s/ELK_CLOUD_ID/$ELK_CLOUD_ID/g" /etc/filebeat/filebeat.yml
          sed -i "s/ELK_CLOUD_AUTH/$ELK_CLOUD_AUTH/g" /etc/filebeat/filebeat.yml
          sed -i "s/ELASTIC_APM_ENV/$ELASTIC_APM_ENV/g" /etc/filebeat/filebeat.yml
          sed -i "s/ELK_AWS_ACCESS_KEY_ID/$ELK_AWS_ACCESS_KEY_ID/g" /etc/filebeat/filebeat.yml
          sed -i "s/ELK_AWS_SECRET_ACCESS_KEY/$ELK_AWS_SECRET_ACCESS_KEY/g" /etc/filebeat/filebeat.yml
          sed -i "s/AWS_REGION/$AWS_REGION/g" /etc/filebeat/filebeat.yml
          sed -i "s/ACCOUNT_ID/$ACCOUNT_ID/g" /etc/filebeat/filebeat.yml
          sed -i "s/ELASTIC_APM_ENV/$ELASTIC_APM_ENV/g" /etc/filebeat/filebeat.yml
          curl -L -O https://artifacts.elastic.co/downloads/beats/filebeat/filebeat-8.8.1-x86_64.rpm
          sudo rpm -vi filebeat-8.8.1-x86_64.rpm
          sudo service filebeat start
      # Commands that will be run on container_commmands
      # Here the container variables will be visible as environment variables.
commands:
  1_command:
    command: "./beat_env_setup.sh"
    cwd: /home/ec2-user
files:
  "/etc/metricbeat/metricbeat.yml":
    mode: "000755"
    owner: root
    group: root
    content: |
      metricbeat.config.modules:
        path: ${path.config}/modules.d/*.yml
        reload.period: 10s
        reload.enabled: true
      metricbeat.max_start_delay: 10s
      setup.dashboards.enabled: true
      metricbeat.modules:
      - module: system
        metricsets:
          - cpu             # CPU usage
          - load            # CPU load averages
          - memory          # Memory usage
          - network         # Network IO
          - process         # Per process metrics
          - process_summary # Process summary
          - uptime          # System Uptime
          - socket_summary  # Socket summary
          #- core           # Per CPU core usage
          #- diskio         # Disk IO
          #- filesystem     # File system usage for each mountpoint
          #- fsstat         # File system summary metrics
          #- raid           # Raid
          #- socket         # Sockets and connection info (linux only)
          #- service        # systemd service information
        enabled: true
        period: 10s
        processes: ['.*']

        # Configure the mount point of the host’s filesystem for use in monitoring a host from within a container
        #hostfs: "/hostfs"

        # Configure the metric types that are included by these metricsets.
        cpu.metrics:  ["percentages","normalized_percentages"]  # The other available option is ticks.
        core.metrics: ["percentages"]
      cloud.id: "ELK_CLOUD_ID"
      cloud.auth: "ELK_CLOUD_AUTH"
      logging.to_files: true
      logging.files:
        # Configure the path where the logs are written. The default is the logs directory
        # under the home path (the binary location).
        path: /var/log/metricbeat
      name: 'api-server-ELASTIC_APM_ENV'
      fields:
        env: ELASTIC_APM_ENV
      processors:
        - add_host_metadata: ~
        - add_cloud_metadata: ~

  "/home/ec2-user/metric_beat_env_setup.sh":
    mode: "000755"
    owner: root
    group: root
    content: |
      #!/bin/bash
          ELK_CLOUD_AUTH=$(/opt/elasticbeanstalk/bin/get-config environment -k ELK_CLOUD_AUTH)
          ELK_CLOUD_ID=$(/opt/elasticbeanstalk/bin/get-config environment -k ELK_CLOUD_ID)
          ELK_AWS_ACCESS_KEY_ID=$(/opt/elasticbeanstalk/bin/get-config environment -k ELK_AWS_ACCESS_KEY_ID)
          ELASTIC_APM_ENV=$(/opt/elasticbeanstalk/bin/get-config environment -k ELASTIC_APM_ENV)
          ELK_AWS_SECRET_ACCESS_KEY=$(/opt/elasticbeanstalk/bin/get-config environment -k ELK_AWS_SECRET_ACCESS_KEY)
          AWS_REGION=$(ec2-metadata --availability-zone | cut -d " " -f 2 | sed 's/.$//')
          AWS_INSTATANCE_ID=$(ec2-metadata --instance-id | cut -d " " -f 2)
          sed -i "s/ELK_CLOUD_ID/$ELK_CLOUD_ID/g" /etc/metricbeat/metricbeat.yml
          sed -i "s/ELK_CLOUD_AUTH/$ELK_CLOUD_AUTH/g" /etc/metricbeat/metricbeat.yml
          sed -i "s/ELK_AWS_ACCESS_KEY_ID/$ELK_AWS_ACCESS_KEY_ID/g" /etc/metricbeat/metricbeat.yml
          sed -i "s/ELK_AWS_SECRET_ACCESS_KEY/$ELK_AWS_SECRET_ACCESS_KEY/g" /etc/metricbeat/metricbeat.yml
          sed -i "s/AWS_REGION/$AWS_REGION/g" /etc/metricbeat/metricbeat.yml
          sed -i "s/AWS_INSTATANCE_ID/$AWS_INSTATANCE_ID/g" /etc/metricbeat/metricbeat.yml
          sed -i "s/ELASTIC_APM_ENV/$ELASTIC_APM_ENV/g" /etc/metricbeat/metricbeat.yml
          curl -L -O https://artifacts.elastic.co/downloads/beats/metricbeat/metricbeat-8.8.1-x86_64.rpm
          sudo rpm -vi metricbeat-8.8.1-x86_64.rpm
          metricbeat modules enable aws
          sudo service metricbeat start
          sudo service metricbeat restart
      # Commands that will be run on container_commmands
      # Here the container variables will be visible as environment variables.

commands:
  1_command:
    command: "./metric_beat_env_setup.sh"
    cwd: /home/ec2-user
Using the above script you can configure filebeat and metricbeat into the beanstalk application
ELK APM Configured:
const config = require('./config');

const apm = require('elastic-apm-node').start({
  serviceName: config.ELASTIC_APM_SERVICE_NAME,
  secretToken: config.ELASTIC_APM_SERVICE_SECRET,
  serverUrl:  config.ELASTIC_APM_SERVER_URL,
  environment: config.ELASTIC_APM_ENV

})

function apmErrorCapture(err){
  apm.captureError(err)
}

module.exports ={
  apmErrorCapture,
  apm
}
we set the userId for APM
app.use(function (req, res, next) {
  const userId = req.headers['x-user-id']
  if (userId) {
    apm.setUserContext({id: userId})
  }
  next()
})
Custom Logging with log4j:
const log4js = require('log4js');
const {apm} = require("../../config/elk-apm");
const { logger } = require('elastic-apm-node');
log4js.configure({
    appenders: {
        default: {
            type: 'file',
            layout: {
                type: 'pattern',
                pattern: '[%d] [%p] - %m',
            },
            filename: './logs/shell.log'
        },
        error: {
            type: 'file',
            layout: {
                type: 'pattern',
                pattern: '[%d] [%p] - %m',
            },
            filename: './logs/errors.log'
        },
        warning: {
            type: 'file',
            layout: {
                type: 'pattern',
                pattern: '[%d] [%p] - %m',
            },
            filename: './logs/warnings.log'
        },
        event: {
            type: 'file',
            layout: {
                type: 'pattern',
                pattern: '[%d] [%p] - %m',
            },
            filename: './logs/events.log'
        },
        message: {
            type: 'file',
            layout: {
                type: 'pattern',
                pattern: '[%d] [%p] - %m',
            },
            filename: './logs/messages.log'
        },
        query: {
            type: 'file',
            layout: {
                type: 'pattern',
                pattern: '[%d] [%p] - %m',
            },
            filename: './logs/queries.log'
        },
    },
    categories: {
        default: { appenders: ['default'], level: 'ALL' },
        errors: { appenders: ['error'], level: 'ERROR' },
        warnings: { appenders: ['warning'], level: 'WARN' },
        events: { appenders: ['event'], level: 'INFO' },
        messages: { appenders: ['message'], level: 'INFO' },
        queries: { appenders: ['query'], level: 'TRACE' }
    },
});

const Logger = {
    DEFAULT: 'shell',
    ERROR: 'errors',
    EVENT: 'events',
    MESSAGE: 'messages',
    WARNING: 'warnings',
    QUERY: 'queries',
    createLogger: (event) => {
        log(logger.MESSAGE, `${JSON.stringify(event)}`);
    },

};

const log = (phase, message) => {
    let traceId = apm?.currentTraceIds?.['trace.id']
    let logMessage = `${message}`;
    switch (phase) {
        case Logger.ERROR:
            log4js.getLogger(phase).error(logMessage,traceId);
            break;
        case Logger.EVENT:
            log4js.getLogger(phase).info(logMessage,traceId);
            break;
        case Logger.MESSAGE:
            log4js.getLogger(phase).info(logMessage,traceId);
            break;
        case Logger.WARNING:
            log4js.getLogger(phase).warn(logMessage,traceId);
            break;
        case Logger.QUERY:
            log4js.getLogger(phase).trace(logMessage,traceId);
            break;
        default:
            log4js.getLogger(Logger.DEFAULT).info(logMessage, traceId);
            break;
    }
}

module.exports = Logger;
When writing custom logs, we include an APM trace ID, allowing us to associate these logs with a transaction
Microservice Distributed Tracing:
We have a microservice that functions using an event-driven manager. It runs on a serverless stack, and all logs are written to CloudWatch. When we log, we include a trace ID.
* This is the logger configuration for our Lambda function.
LOGGER.debug(`${COMPONENT}`,"Processing message - basicEventHandler", eventPayload.traceId );
- We are pushing events from our API to the event service
const Logger = require('../helpers/LoggerService.js');
const {apmErrorCapture, apm} = require("../../config/elk-apm")

async function generateEvent(type, metadata) {
    try{
        const traceId = apm?.currentTraceIds?.['trace.id']
        let event = {
            type: type,
            eventId: uuidv4(),
            createdAt: Date.now(),
            traceId
        }

        switch (type) {
            case STAFF_LIST_CHANGE:
                event = await decorateStaffListChange(event, metadata);
                break;
            case PATIENT_LIST_CHANGE:
                event = await decoratePatientListChange(event, metadata);
                break;
            case PATIENT_CHANGE:
                event = await decoratePatientChange(event, metadata);
                break;
            case NOTIFICATION:
                event = await decorateNotification(event, metadata);
                break;
            default:
                event = null;
                break;
        }
        Logger.createSqsEventLogger(event);
        if (event) {
            const eventRes = await sendSQSEvent(event);
            Logger.createSqsEventLogger(eventRes);
        }
    } catch(error){
        apmErrorCapture(error)
        throw error;
    }
}

module.exports = {
    generateEvent
}
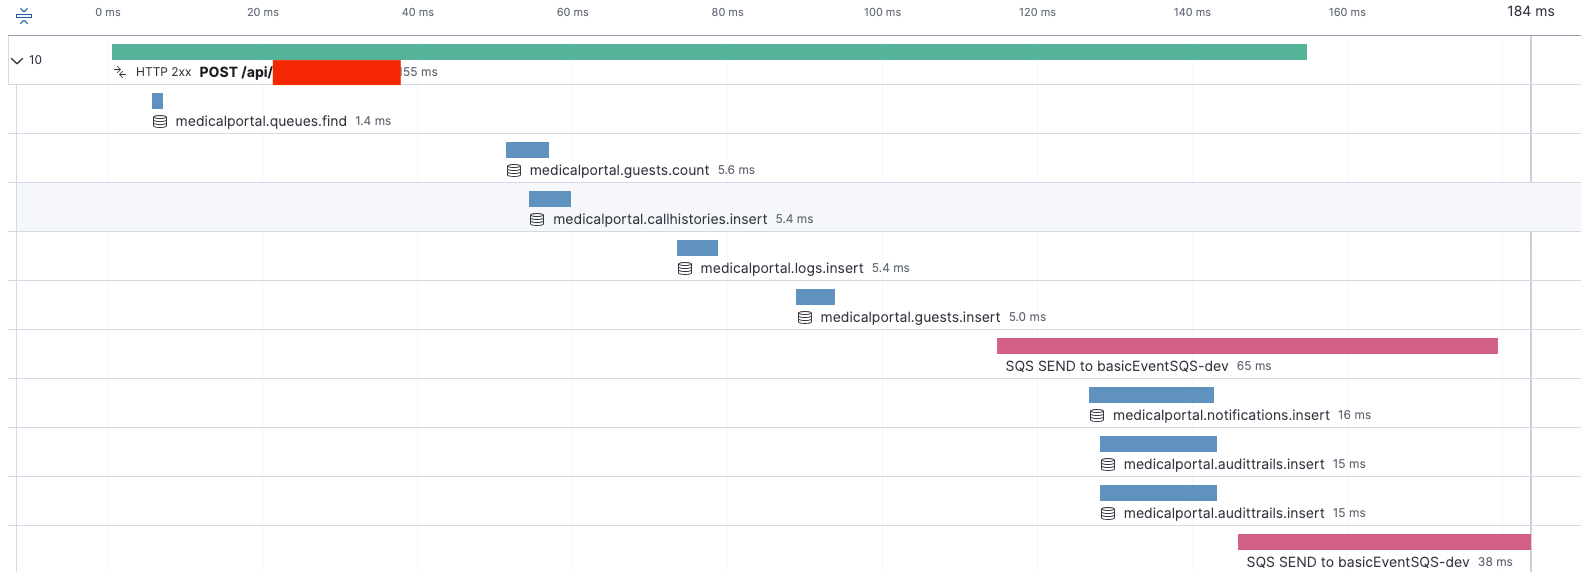
Monitoring and Observability:
This is how the time is taken to interact with services in a transaction
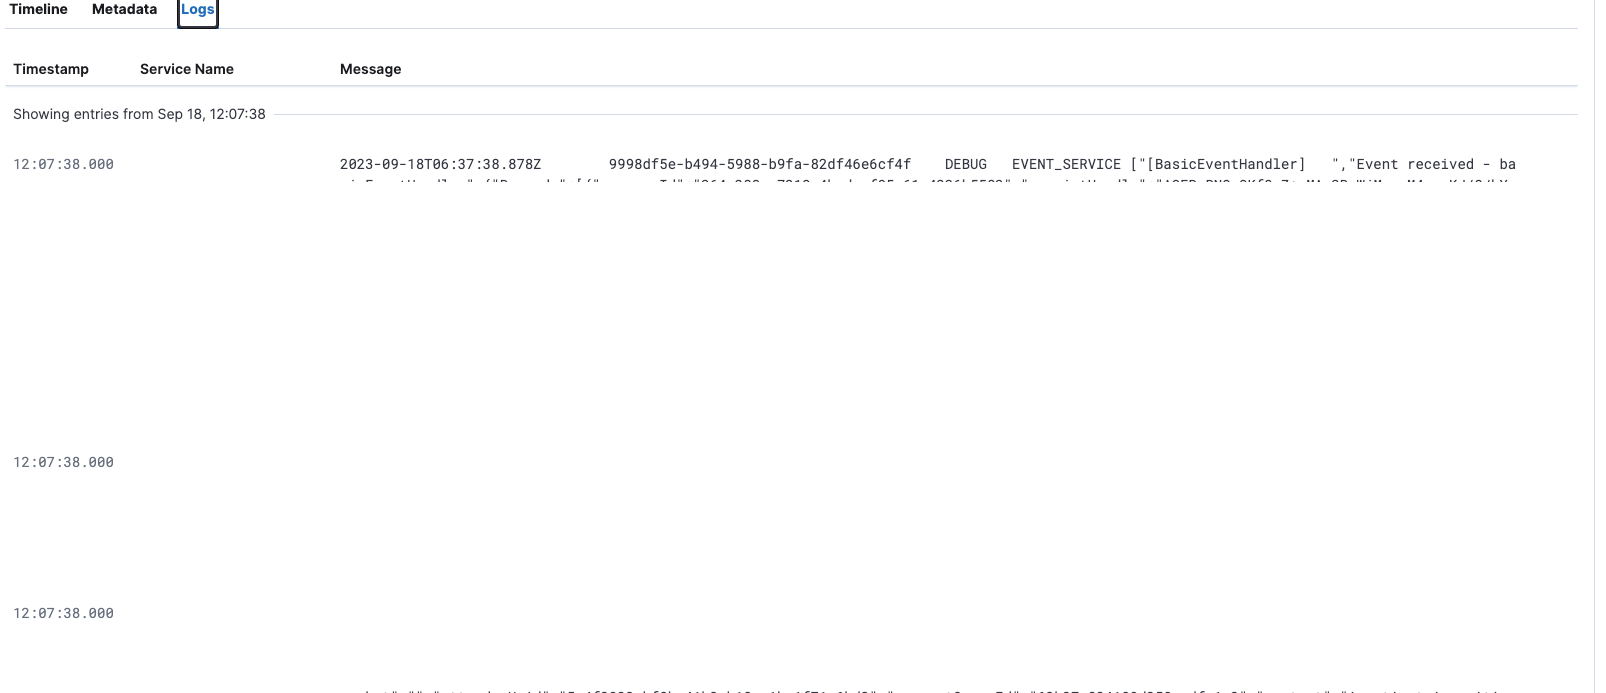
This is how event service logs are added to the transaction.
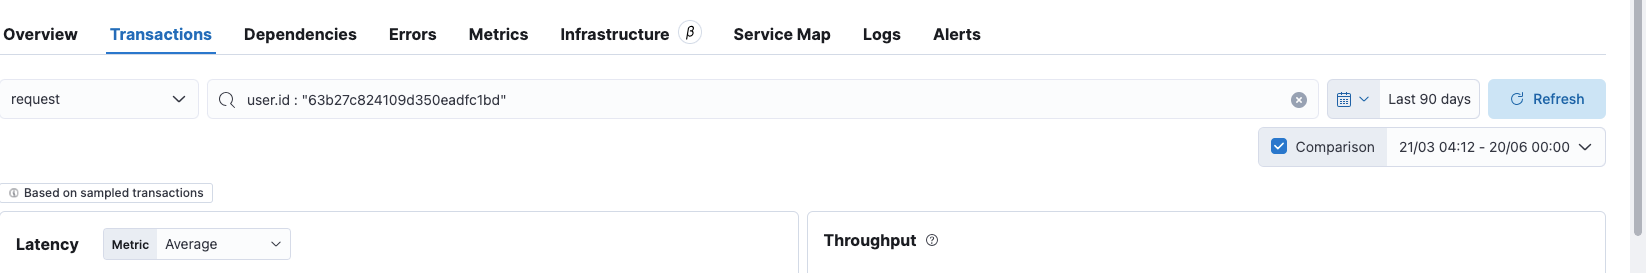
Traceability and Troubleshooting:
If a user reports an issue, we can list all transactions and all errors using their ID
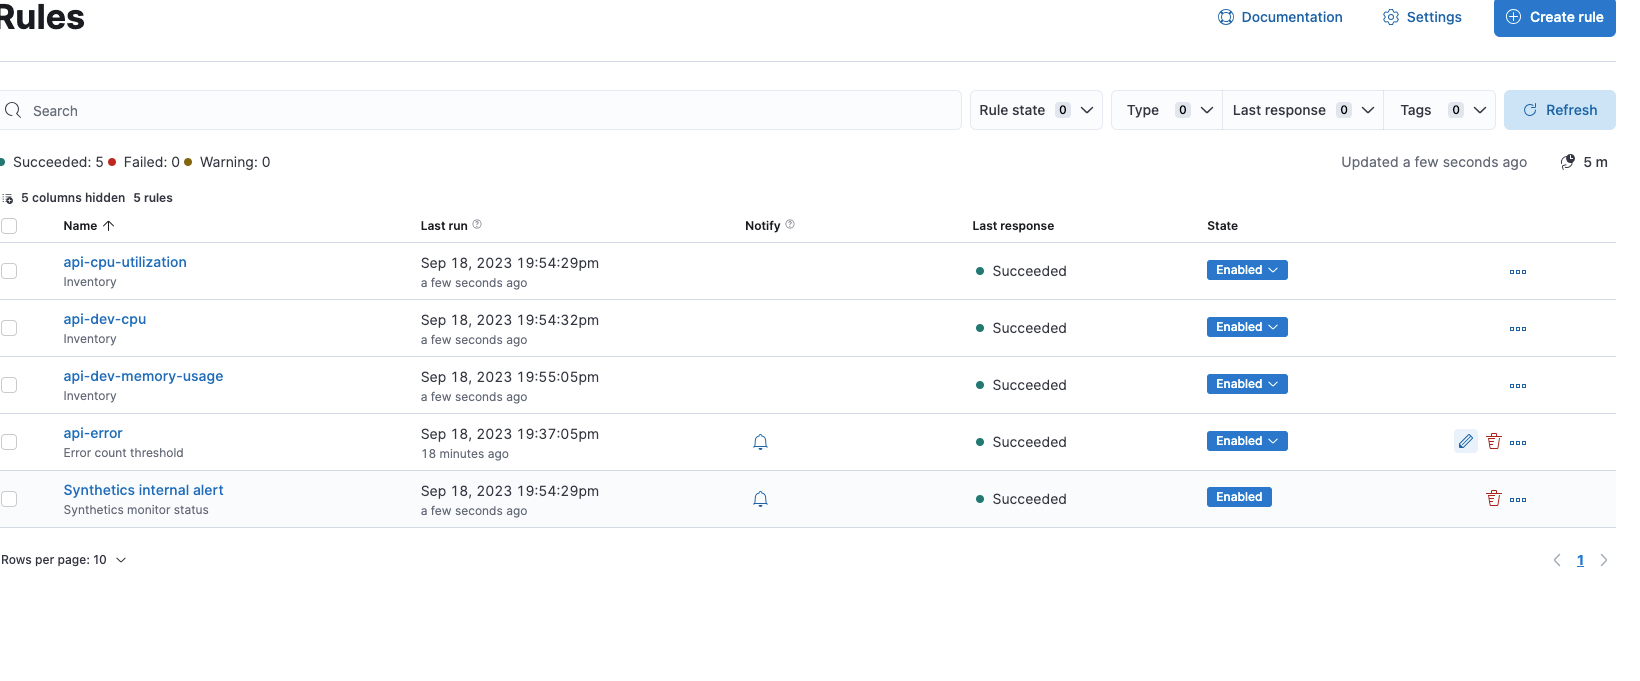
Alert Configuration:
We have configured alerts to be sent via email and Slack
In today's complex world of microservices, monitoring and tracing have become more critical than ever before. As we've explored in this blog, implementing a monitoring system, complete with distributed tracing, offers numerous benefits. It allows us to detect and resolve issues proactively, ensuring that our applications run smoothly and our users enjoy a seamless experience


