Introduction:
In today's fast-paced web development landscape, optimizing the performance of React applications is crucial to ensure a smooth and responsive user experience. One powerful tool that can help developers achieve this goal is React Profiler. React Profiler allows you to measure and analyze the rendering performance of your React components, giving you valuable insights into potential bottlenecks and areas for optimization. In this blog post, we will dive into the world of React Profiler, exploring its features, setup process, and how to interpret its results. By the end, you'll be equipped with the knowledge and tools needed to supercharge your React applications and deliver exceptional performance to your users.
What is React Profiler:
React Profiler is a tool provided by the React library that allows developers to measure and analyze the rendering performance of their React components. It provides detailed information about the time it takes for components to render and re-render, helping developers identify potential performance bottlenecks. Developers can analyze different parts of their project component tree and records the rendering process and time, when using react profiler.
One important aspect of React Profiler is the ability to analyze the recorded data. It provides various metrics, including "actual time," "base time," and "render count." The "actual time" represents the total time spent rendering a component and its descendants, while the "base time" represents the time spent on rendering the component itself, excluding any work performed by its children. The "render count" indicates how many times a component has been rendered.
By analyzing these metrics, developers can identify components that are causing excessive rendering times or unnecessary re-renders. This information can guide optimization efforts, such as implementing memoization techniques, optimizing state management, or reducing unnecessary rendering by utilizing React's React.memo.
Setting up React Profiler in the browser:
- Ensure React Version Compatibility:
- React Profiler is available starting from React version 16.5 and above. Ensure that your React application is using a compatible version.
2. Install React DevTools Extension:
- React Profiler is part of the React DevTools package, so you'll need to install the React DevTools extension in your browser. It is available for popular browsers like Chrome, Firefox, and Edge.
- Visit the respective extension store for your browser and search for "React DevTools". Follow the installation instructions to add the extension.
https://chrome.google.com/webstore/detail/react-developer-tools/fmkadmapgofadopljbjfkapdkoienihi
3. Add React DevTools to Your Application:
- Import the React DevTools package in your application's entry file (usually
index.jsorApp.js). - Include the following line of code before rendering your React app:
import 'react-devtools'. - This enables the React DevTools extension to connect to your application.
4. Enable React Developer Tools in Browser:
- Open the browser where you installed the React DevTools extension.
- Ensure that the extension is enabled and active. You may find the React DevTools icon in the browser's toolbar or extension menu.
Start Your React Application:
- Start your React application in development mode.
- You can typically do this by running the command
npm startoryarn startin your project's root directory. - Make sure you are running the development server and not the production build.
5. Open the Browser Developer Tools:
- Open your React application in the browser.
- Right-click anywhere on the page and select "Inspect" or use the shortcut key (e.g., Ctrl+Shift+I on Chrome).
- This will open the browser's Developer Tools panel.
6. Access React Profiler:
- Within the Developer Tools panel, look for the "React" or "Components" tab.
- Click on it to open the React Developer Tools panel.
- In the panel, you should find the "Profiler" tab, which allows you to access and use React Profiler.
7. Start Profiling:
- In the React Profiler tab, click the "Record" button to start profiling your React components.
- You can then interact with your application to trigger different component renderings and capture performance data.
8. Analyze Profiling Data:
- Once you've captured profiling data, you can analyze it within the React Profiler panel.
- You'll see a visualization of your component tree along with various performance metrics.
- Use this information to identify components with long render times, excessive re-renders, or other performance issues.
Profiling with React Profiler:
1. Mark Components for Profiling:
- In your React code, identify the components or sections that you want to profile for performance.
- Wrap these components or sections with the
<React.Profiler>component provided by React. - The
<React.Profiler>component accepts two props:id(a unique identifier for the profiler) andonRender(a callback function to handle the profiling data).
2. Configure the Profiling Callback:
- In the
onRendercallback function, define the logic to handle the profiling data. - The
onRenderfunction receives parameters such asid,phase,actualDuration,baseDuration,startTime, andcommitTime. - You can log this data to the console, send it to an analytics service, or perform any other desired actions.
3. Start Profiling:
- Once you have marked the desired components and defined the
onRendercallback, start your React application in development mode. - Interact with your application to trigger the rendering of the marked components.
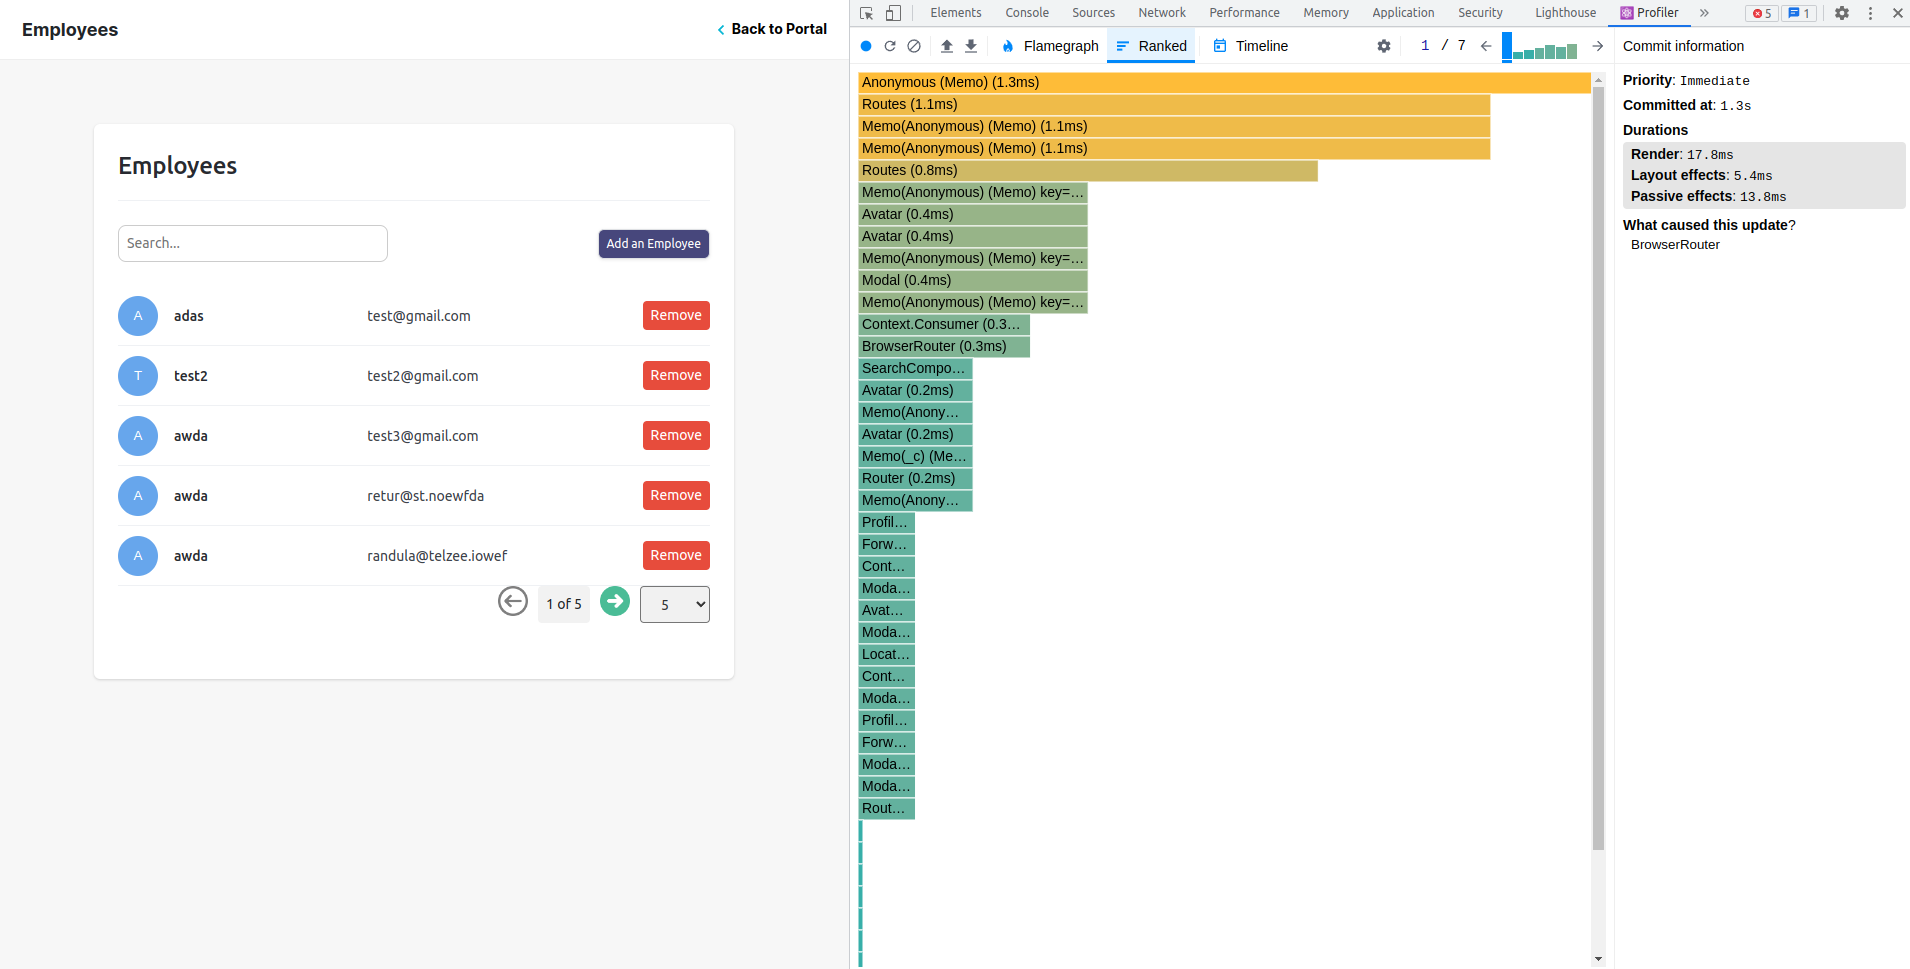
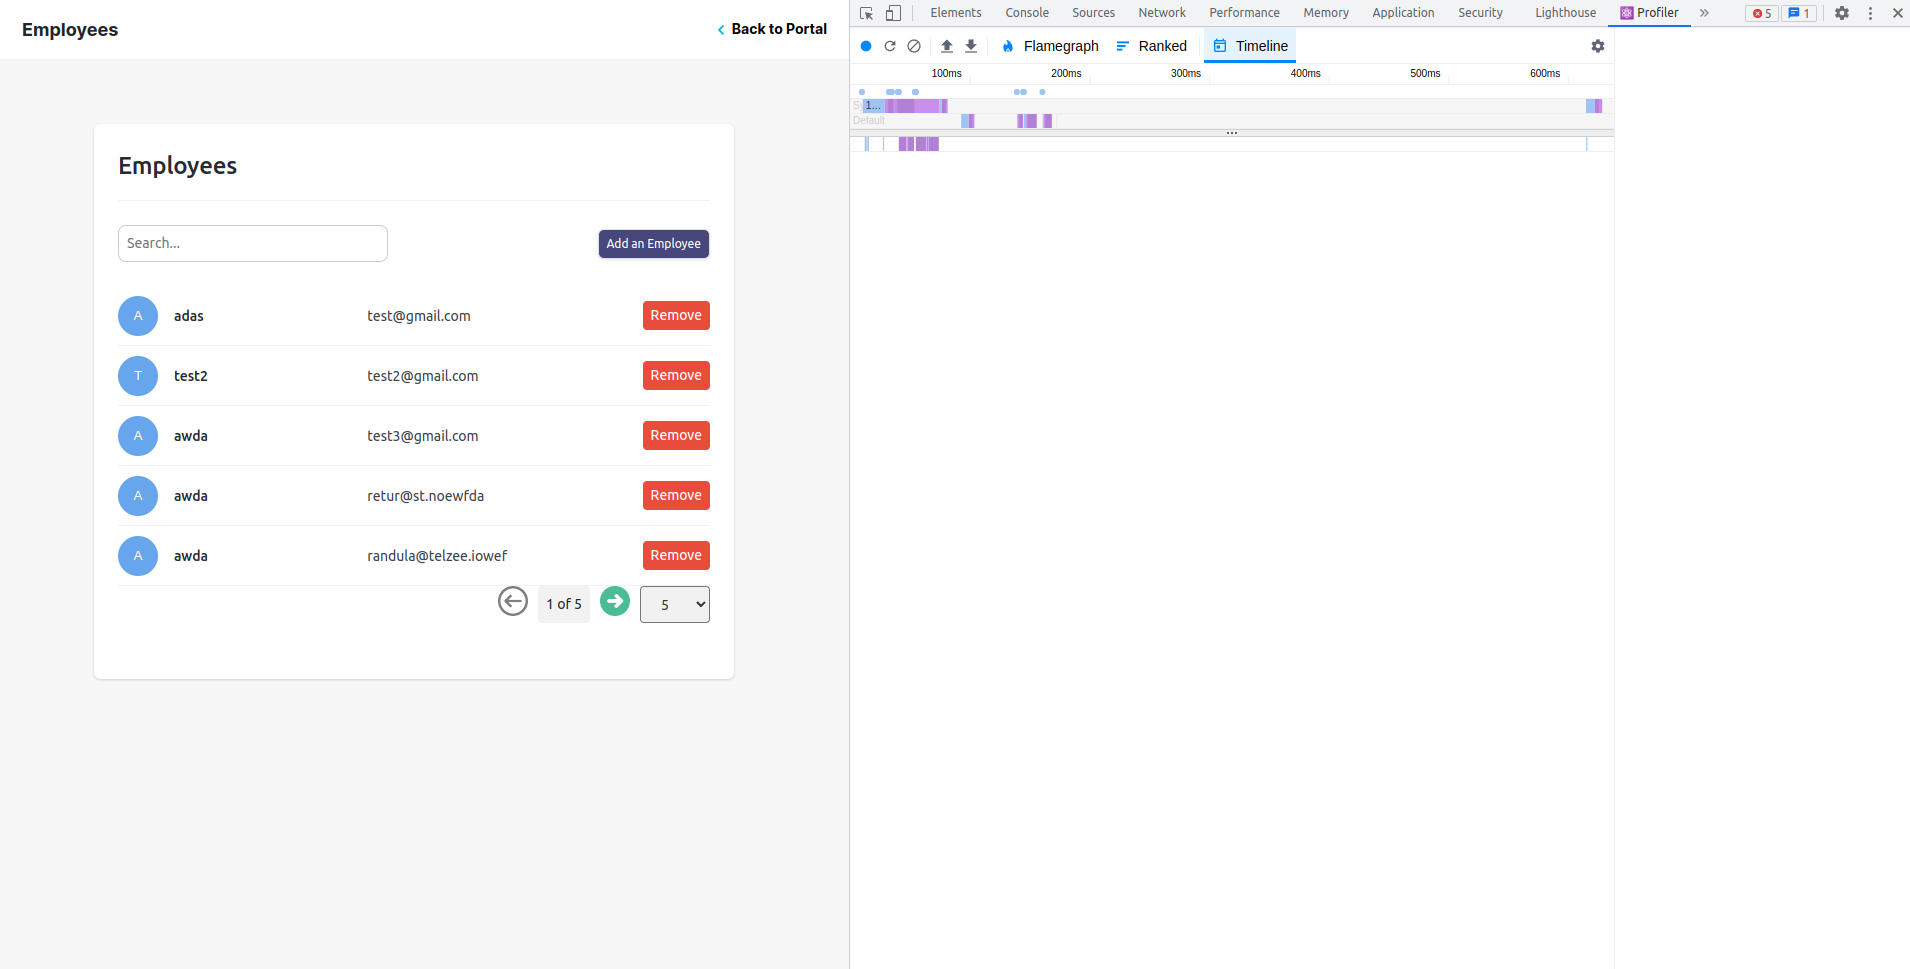
4. View Profiling Data:
- Open your browser's Developer Tools panel and navigate to the React Profiler tab.
- You should see a visualization of your component tree along with the captured performance data.
- The data includes metrics such as "actual time," "base time," and "render count" for each component.
5. Analyze Profiling Data:
- Use the performance data to identify components with high rendering times, excessive re-renders, or other performance issues.
- Look for potential bottlenecks or areas where optimization is needed.
- You can also compare the performance of different components or different runs to track improvements.
Analyzing Profiler Results:
Actual Time:
- Actual Time
- The "actual time" metric represents the total time spent rendering a component and its descendants.
- Higher actual time values indicate that a component and its children are taking longer to render.
- Components with significantly higher actual time may be potential performance bottlenecks.
2. Base Time:
- The "base time" metric represents the time spent rendering the component itself, excluding any work performed by its children.
- Base time helps differentiate between the time spent by the component and the time spent on its children.
- Higher base time values suggest that optimizations may be needed within the component itself.
3. Render Count:
- The "render count" metric indicates how many times a component has been rendered.
- High render counts may suggest excessive re-renders, which can impact performance.
- Identifying components with unnecessary re-renders can help optimize the rendering process.
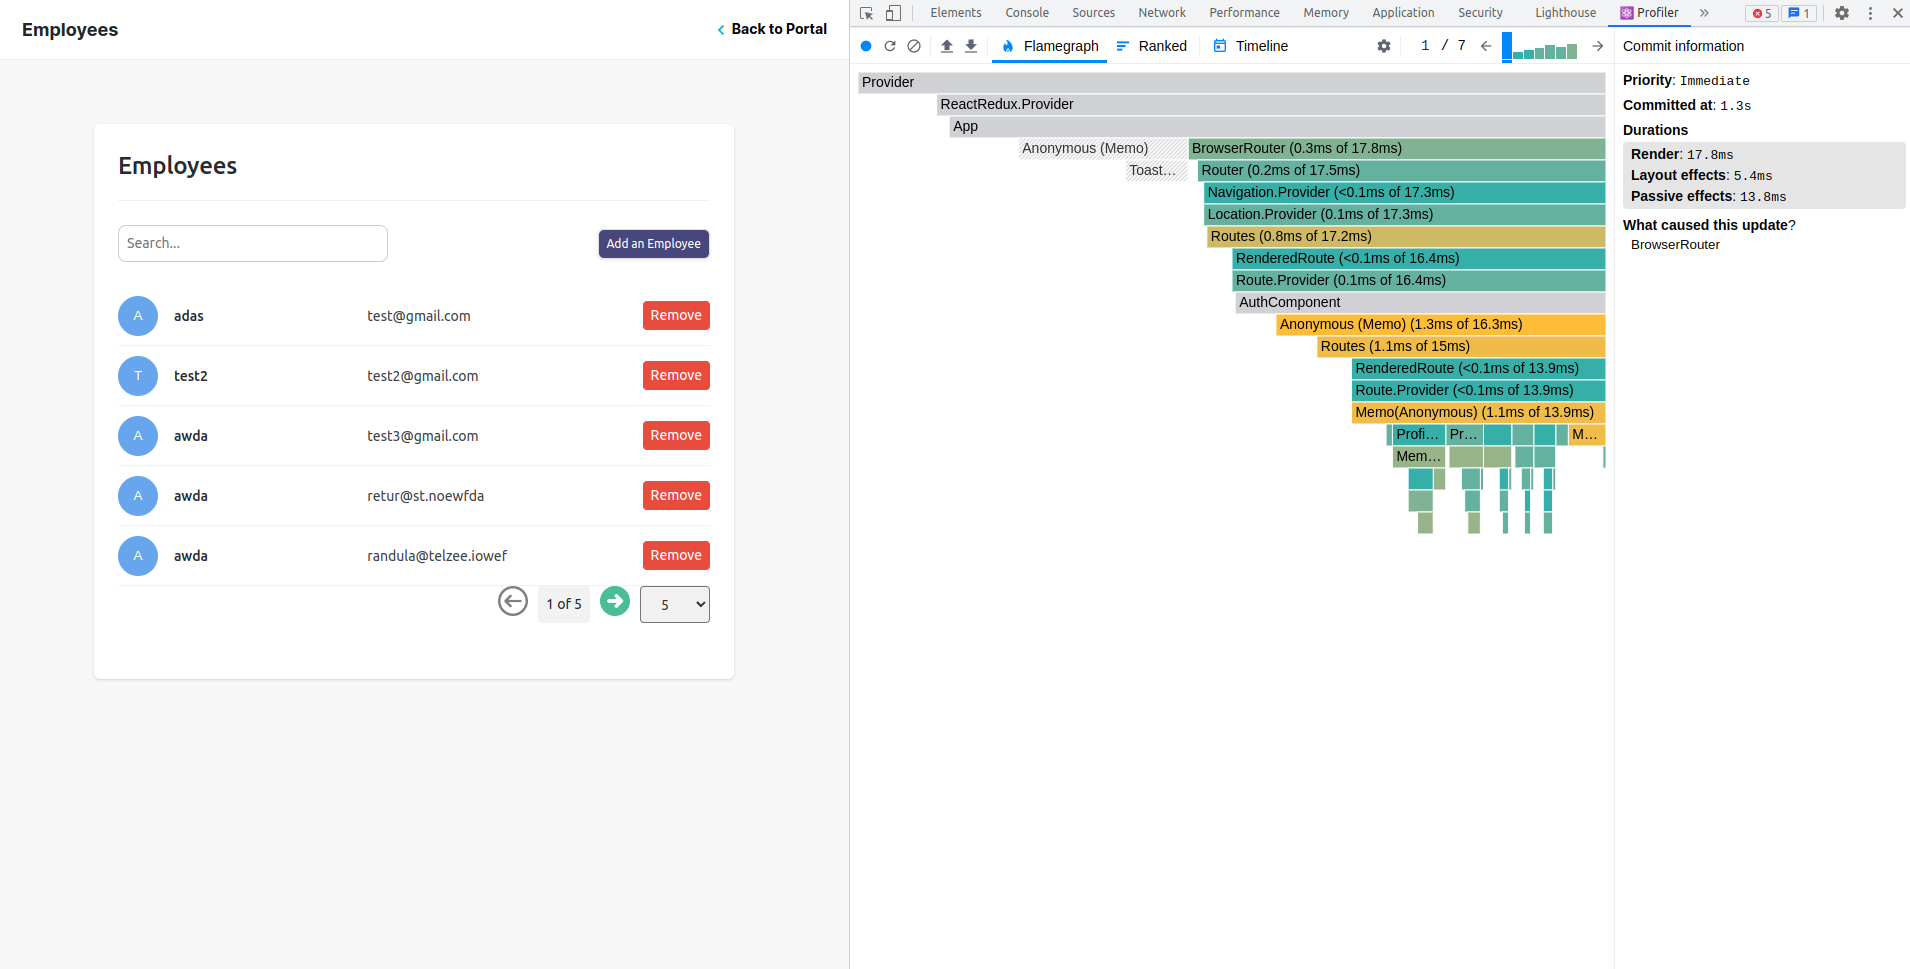
4. Component Tree Visualization:
- The component tree visualization in React Profiler shows the hierarchy of your React components.
- It helps you understand the relationships and dependencies between components.
- By analyzing the tree, you can identify components that are rendering more frequently or have long rendering times.
5. Comparing Profiling Runs:
- React Profiler allows you to compare performance data between different profiling runs.
- This feature is useful for tracking improvements or regressions over time.
- By comparing the metrics, such as actual time or render count, you can assess the impact of optimizations made between different runs.
6. Identifying Performance Bottlenecks:
- Look for components with high actual time or base time values, as they are likely candidates for optimization.
- Focus on components that are frequently re-rendered or have a high render count.
- Consider whether certain components can be memoized or optimized to reduce unnecessary re-renders.
7. Prioritizing Optimizations:
- Based on the profiler results, prioritize optimizations for components that have the highest impact on rendering performance.
- Consider optimizing components with long actual time, high base time, or frequent re-renders.
- Review the code within these components for potential improvements, such as optimizing expensive computations or avoiding unnecessary updates.
Optimizing performance can be done using multiple techniques, i have futther discussed the methods that can be used, in below blog,
Real world Examples:
<div className="employeesArray">
                  {Array.isArray(employees) &&
                    employees.map((employee, index) => (
                      <EmployeeCard
                        key={employee._id}
                        employeeData={employee}
                        action="REMOVE"
                        onConfirmation={handleConfirmation}
                        buttonLabel="Remove"
                        modalContent="Are you sure you want to remove this employee?"
                      />
                    ))}
              </div>
this code is used to render a details of employees. This component can be caused render issues. We can use react profiler to check and analyze the issues.
<Profiler id="EmployeeCard" onRender={callback}>
                      <EmployeeCard
                        key={employee._id}
                        employeeData={employee}
                        action="REMOVE"
                        onConfirmation={handleConfirmation}
                        buttonLabel="Remove"
                        modalContent="Are you sure you want to remove this employee?"
                      />
                    </Profiler>
 const callback = (id, phase, actualTime, baseTime) => {
    console.log(`Component "${id}" rendered in ${actualTime}ms`);
    console.log(`Base time: ${baseTime}ms`);
  };
we can get the base time and actual time to render the component using this method.