Introduction
In today's fast-paced digital world, user experience is paramount, and slow-loading applications can be a major turn-off. As developers, we strive to create highly performant applications that deliver seamless experiences to our users. In the realm of front-end development, React has gained immense popularity due to its component-based architecture and reactivity. However, to truly harness the power of React, it is crucial to optimize its performance.
In this blog, we will dive into the world of React performance optimization and explore various techniques and strategies to supercharge your React applications. We'll uncover ways to identify performance bottlenecks, optimize component rendering, leverage virtualization for large datasets, implement code splitting and lazy loading, harness the power of memoization and caching, optimize network requests, and follow best practices for top-notch performance. By implementing these optimization techniques, you'll be able to create blazing-fast React applications that provide a seamless user experience.
React Profiler
import { Profiler } from 'react';

const useEmployees = () => {
  // ...

  useEffect(() => {
    const onRenderCallback = (
      id,
      phase,
      actualDuration,
      baseDuration,
      startTime,
      commitTime,
      interactions
    ) => {
      console.log(`Component ${id} took ${actualDuration}ms to render`);
    };

    const fetchEmployees = () => {
      // Fetch employees logic...
    };

    // Wrap the fetchEmployees function with the Profiler
    const wrappedFetchEmployees = Profiler.wrap(fetchEmployees, onRenderCallback);

    // Use the wrapped fetchEmployees function in the useEffect hook
    useEffect(() => {
      wrappedFetchEmployees();
    }, [organization, searchQuery, pagination]);

    // ...
  }, [organization, searchQuery, pagination]);

  // ...
};
In this example, the onRenderCallback function logs the rendering time for each rendered component to the console. The fetchEmployees function is wrapped with the Profiler.wrap method, which returns a new function that automatically triggers the onRenderCallback whenever fetchEmployees is called.
By wrapping the relevant functions with the Profiler, you can gain insights into the rendering time of different components within the useEmployees custom hook. This allows you to identify any potential performance bottlenecks and focus your optimization efforts accordingly.
Remember to remove the console.log statements once you have collected the necessary profiling information. Additionally, you can customize the onRenderCallback function to capture additional performance metrics or perform other analysis based on your specific requirements.
The Chrome Profiler extension is a powerful tool that comes bundled with Google Chrome's developer tools. It allows you to record, analyze, and optimize the performance of your web applications. The Profiler extension provides a visual representation of the performance profile, allowing you to identify performance bottlenecks, optimize code, and improve the overall performance of your application.
- Performance Recording: The Profiler extension enables you to record and analyze the performance of your web application in real time. You can initiate a performance recording session and capture data about CPU usage, memory allocation, rendering, JavaScript execution, and more.
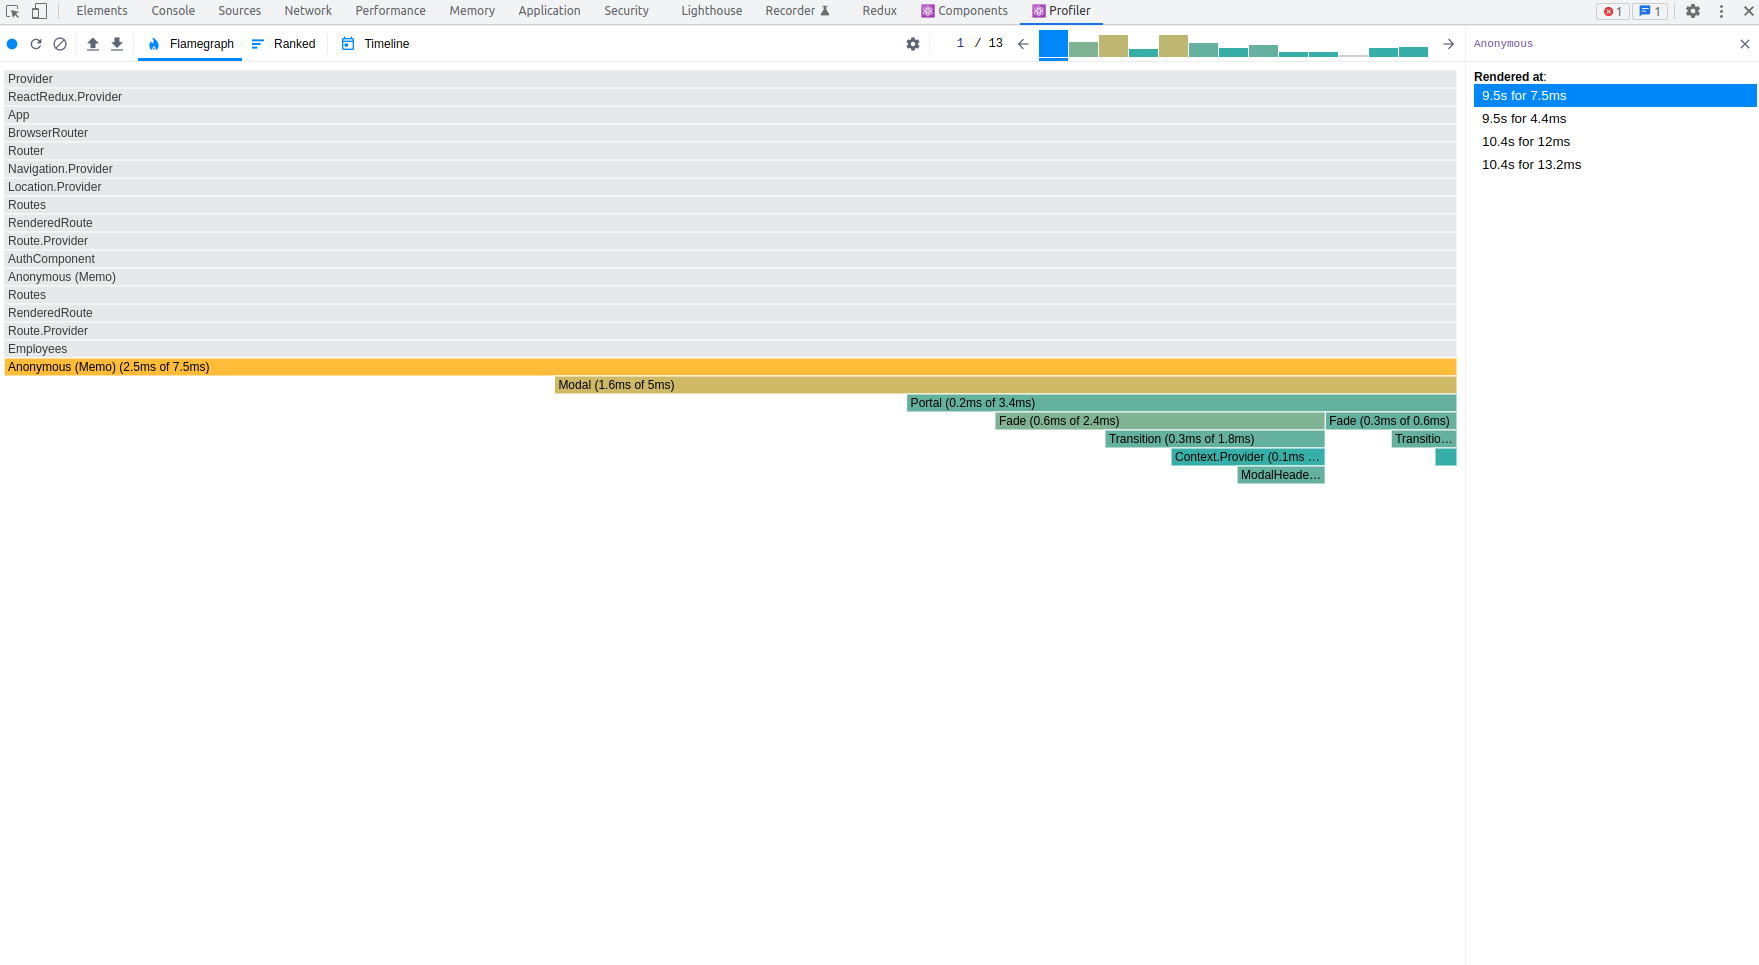
- Flame Charts: The Profiler extension presents performance data in the form of flame charts, which provide a visual representation of the execution time of different functions and components within your application. Flame charts help you identify hotspots and areas of inefficiency.
- CPU and Memory Analysis: With the Profiler extension, you can analyze CPU and memory usage during the execution of your application. It allows you to identify excessive CPU usage, memory leaks, and inefficient memory allocation patterns.
- User Interactions: The Profiler extension enables you to correlate user interactions with performance data. You can see how user actions impact the performance of your application, helping you optimize critical user flows and interactions.
- JavaScript Profiling: The Profiler extension provides JavaScript profiling capabilities, allowing you to analyze the execution time of JavaScript functions and identify slow-performing code. It helps you pinpoint areas where code optimizations can be applied.
- Heap Snapshots: You can take heap snapshots with the Profiler extension to analyze memory allocation patterns and identify potential memory leaks or inefficient memory usage. Heap snapshots provide insights into the memory footprint of your application.
- Performance Comparisons: The Profiler extension allows you to compare performance profiles from different recordings. This feature helps you assess the impact of code changes or optimizations on the performance of your application over time.
To access the Chrome Profiler extension:
Open Google Chrome and navigate to your web application.
Right-click on your web page and select "Inspect" from the context menu.
In the developer tools panel, click on the "Performance" tab.
Component Rendering Optimization
1. Debouncing and Caching with useCallback and useRef:
- Debounce the search query updates to avoid triggering frequent API requests. Wrap the
setSearchQueryfunction withuseCallbackand useuseRefto store a reference to the debounced search query value. This ensures that the API request is only made after a certain delay of user inactivity. For example:
import debounce from "lodash.debounce";

const fetchEmployees = useCallback(
    debounce(() => {
      const query = searchQuery !== '' ? searchQuery : undefined;
      batch(() => {
        dispatch(
          employeesSliceActions.getEmployees({
            filters: { ...filters, organizationId: organization?._id, page: pagination?.page, searchQuery: query, limit: pagination?.limit },
          })
        );
      });
`
    }, 300), // Debounce for 300 milliseconds
    [searchQuery, dispatch, filters, organization, pagination]
  );`
`
2. Preventing Unnecessary Rerenders with React.memo:
- Memoize the child components within the
useEmployeescomponent usingReact.memo. This prevents unnecessary re-rendering of components if their props haven't changed. For example:
const Paginator: React.FC<PaginatorProps> = memo(
  ({
    hasNextPage,
    hasPreviousPage,
    totalCount,
    onPaginationChange,
    page,
    limit
  }) => {

    const handleNextPage = () => {
      if (hasNextPage) {
        onPaginationChange(page + 1, limit);
      }
    };

    ........


    );
  }
)
3. Dependency Optimization in useEffect:
- Analyze the dependencies of each
useEffecthook and ensure they are accurately specified. Remove any unnecessary dependencies to prevent unnecessary re-execution of the effect. For example:
useEffect(() => {
        fetchEmployees();
    }, [organization, searchQuery, pagination]);

    useEffect(() => {
        fetchEmployees();
    }, [searchQuery]);

    useEffect(() => {
        fetchEmployees();
    }, [pagination]);

    useEffect(() => {
        if (invitationSent && isDirty) {
            reset();
        }
    }, [invitationSent, isDirty]);

    useEffect(() => {
        if (!showRegisterEmployeeModal && isDirty) {
            reset();
        }
    }, [showRegisterEmployeeModal, isDirty]);

    useEffect(() => {
        if (error.data.type === "email") {
            setError("email", { message: error.message }, { shouldFocus: true })
        }
    }, [error, setError]);
By applying these optimization techniques, you can reduce unnecessary re-renders, prevent unnecessary API requests, and optimize the performance of your useEmployees custom hook and component.
Code Splitting and Lazy Loading:
Code splitting and lazy loading are techniques used to optimize the loading and performance of web applications by splitting the code into smaller chunks and loading them only when needed. This can significantly improve the initial loading time of the application and reduce the amount of code that needs to be downloaded by the user.
Here's how you can modify a code to implement code splitting and lazy loading using React.lazy and React.Suspense:
<div className="employeesArray">
                {Array.isArray(employees) &&
                  employees.map((employee, index) => (
                    <React.Suspense fallback={<div>Loading...</div>}>
                      <EmployeeCard
                        key={employee._id}
                        employeeData={employee}
                        action="REMOVE"
                        onConfirmation={handleConfirmation}
                        buttonLabel="Remove"
                        modalContent="Are you sure you want to remove this employee?"
                      />
                    </React.Suspense>
                  ))}
              </div>
When the employees array is still being loaded or updated, the fallback UI will be displayed in place of each <EmployeeCard> component. Once the employees array is fully loaded, the <EmployeeCard> components will be rendered with their respective data. the "Loading..." text is displayed when the employees array is still being loaded, providing a better user experience by indicating that the content is being fetched.
Performance Optimization Best Practices:
Optimize event handlers:
- Use the
useCallbackhook to memoize event handler functions, especially if they are dependencies for other hooks or effects.
const fetchEmployees = useCallback(() => {
        const query = searchQuery !== '' ? searchQuery : undefined;
        batch(() => {
            dispatch(employeesSliceActions.getEmployees({
                filters: { ...filters, organizationId: organization?._id, page: pagination?.page, searchQuery: query, limit: pagination?.limit }
            }));
        });
    }, [searchQuery, dispatch, filters, organization, pagination]);

    const handlePaginationChange = useCallback((newPage: number, newLimit: number) => {
        setPagination((prevPagination) => ({
            ...prevPagination,
            page: newPage,
            limit: newLimit,
        }));
    }, []);

    const handleSearchKey = useCallback((query: any) => {
        setSearchQuery(query);
        setPagination((prevPagination) => ({
            ...prevPagination,
            page: 1,
            limit: pagination.limit,
        }));
    }, [pagination]);
Optimize CSS and layout:
- Minimize CSS animations and transitions that cause layout changes, as they can trigger expensive layout recalculations.
- Avoid using
display: noneorvisibility: hiddento hide elements that are not needed, as they still take up rendering and layout resources. - Instead, consider conditionally rendering components or using CSS classes to control visibility.
- In your example, I don't see any specific CSS or layout optimizations that can be applied. However, make sure to follow best practices when it comes to styling and layout to ensure optimal performance.